
ERP is a data model, with an analytics overlay. It is rigid by design. A system of record has to be. Reliability trumps flexibility. The target audience is not the worker, but the decision maker. This used to be true for all software, even by desk workers. Decades back, desk workers (such as those settling insurance claims) had to do the actual work using tools that offered not much structure – such as Word docs, PDFs, email, and spreadsheets, But the industry evolved systems that empowered the worker while ensuring said work did not happen outside the purview of formalized enterprise software. Collaboration tools, content management platforms, business rules, business process management, the variants of business process management such as case management – all worked towards bringing the desk employee into the web of corporate software.
No such thing has happened for industrial software.
Economic considerations alone do not explain the gap. The potential in industrial software is huge. Take just one use case in the industrial software landscape we at Maximl are familiar with – turnaround planning, scheduling, and execution.
Certain heavy industries deal in chemicals that are hazardous and can potentially cause city-scale damage. Think petrochemicals, oil refineries, industrial gas producers, power generators, and downstream, metals. Due to the potential hazards, such plants must be run with extreme caution, and every element of the complex hierarchy of assets must be periodically inspected due to damage by corrosion and deposition. In addition to addressing concerns around safety and compliance, there is the question of efficiency. For peak operating efficiency periodic inspections are necessary.
The heavy industry’s approach to solving the above is to take the entire asset offline for a few weeks every few years. Oil refineries call them Turnarounds. Power generators call them overhauls. Sometimes they are known by acronyms such as STOs (shutdowns, turnarounds, and outages), TAs or TARs. The periodicity and asset offline time vary. But the principle remains the same.
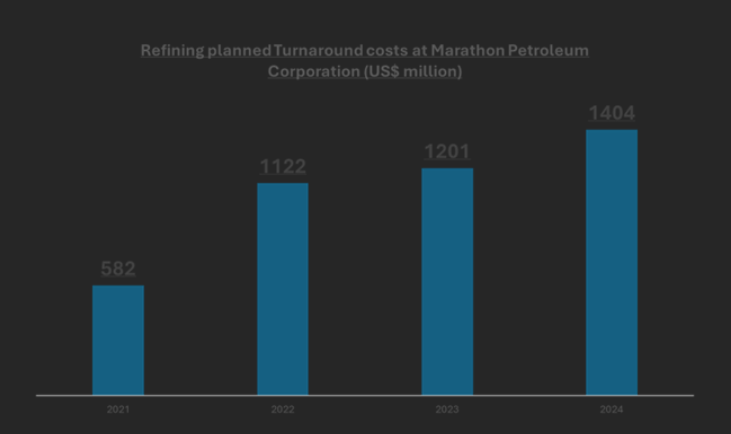
This is also a big spend item for the companies considered. Consider the following:
- Marathon Petroleum Corporation, one of the largest downstream specialists in the US, spent US$1.2 billion in planned turnarounds in 2024. This is about 1 percent of operating revenues. The planned turnaround cost figure is more than a quarter of the figure from income from continuing operations net of tax. This should put the TA problem in perspective. (Source: annual reports)
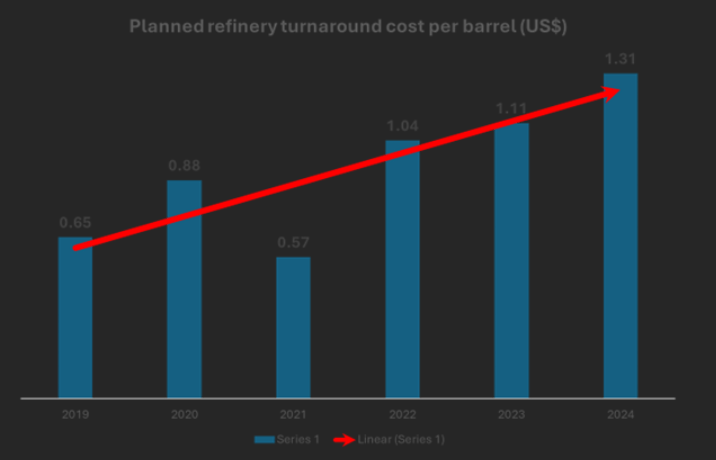
- TA costs are material enough for downstream specialists such as Marathon Petroleum Corporation and Valero to report them in SEC filings. The former reports TA costs per barrel as well. (Source: Annual reports)
- Going by the cost per barrel numbers reported in SEC filings, and the refinery output in the US and elsewhere, the world spends about US$50 billion per annum on TAs.
- The question is – how much of the above could be software?
- According to data from a federal agency tracking downstream oil, a fairly representative Turnaround would last 29 days and cost US$39 million in 2007 (Source: US Energy Administration). The most tangible source of ROI in this category is reducing Turnaround time. Every day the asset stays offline costs the refinery millions in lost sales – and maintenance bills. With a TA digitalization solution bringing in data about assets, manpower, and maintenance workflows, planning is better, and adherence to the plan is improved through the mobility modules of the TAR digitalization solution. The theory is that the TA digitalization can reduce offline days, and the software maker can capture a fraction of the value accrued to the client – the refinery. The question is how many days and what fraction.
- According to a Forrester Research report on ROI of industrial data platforms, shaving five days off Turnarounds is realistic. (Source: Forrester Research)
- The same Forrester Research report says the ROI from the software is 400%. So, on average, a quarter of the value generated accrue to the software maker. (Source: Forrester Research)
- According to the federal agency monitoring refineries, the US market sees about 100 planned Turnarounds a year. (Source: Hydrocarbon Publishing Company)
- The US accounts for 19% of the global refined crude output. That adjustment needs to be made to estimate the size of the global Turnaround Digitalization software market. (Source: US Energy Information Administration)
- We did the above. It stands to reason that parts of the world are less inclined to spend on tech. Therefore, a factor (0.75) has been incorporated in the modelling.
- In addition, oil is just one industry that does Turnarounds. Process engineering industries such as petrochemicals, inorganics, metals, non-metallic minerals, specialty chemicals, and paper & pulp also go through planned capital projects that require the entire asset to be offline. Metals cover both ferrous and non-ferrous. Specialty chemicals covers a wide range of industrial projects such as adhesives, agrichemicals, cleaning agents, colours, cosmetic additives, construction chemicals, food additives, industrial gases, lubricants, fragrances, water management chemicals, oilfield chemicals, catalysts, sealants. There are chemicals with consumer applications such as in pharmaceuticals. Using industry size in terms of revenues and energy expenditure as proxies for spending on large maintenance projects, we arrive at 7.14 as the factor to multiply Turnaround spending on oil refineries with – to arrive spending on asset-heavy process industries.
- 7.14X is a large multiple. It must be treated with caution. Not all asset-heavy industries have reached the level of awareness and technology adoption as downstream oil and petrochemicals. Not every industry is scrutinized as much by regulators and the financial markets. We apply a large deflator to 7.14.
- After doing all the above, we arrive at an approximate figure of US$2.5 billion for the global Turnaround digitalization software market.
- We have made conservative estimates at every step. This is likely the lower end of the range.
Now, a total addressable market (TAM) of US$2.5 billion is a sizable market. But most in the technology industry have never heard of this category. Why?
It is this question we turn to next.