

Consistently churning out high-quality products has long been the gold standard for manufacturers, even before safety and regulatory requirements attained critical importance. In this article, we examine one of the earliest and well-renowned methods of controlling the quality of manufactured products – statistical process control (SPC). We look at its origins, the application, and how digitalization can streamline SPC to make it effortless and more efficient.
Statistical Process Control is the use of statistical techniques to control a process or production method – American Standard of quality
Historical origins of statistical process control
The concept of statistical process control was first introduced in the early 1920s by William Shewhart, an American physicist, engineer, and statistician. Mr. Shewart observed that processes could be monitored and controlled if they are measured, and the resulting data subjected to statistical analysis. His ideas were expounded in the 1939 book, ‘statistical method from the viewpoint of quality control.’ A younger colleague, William Deming further popularized these ideas and integrated them into a wider industrial management philosophy.
In the Second World War (1939-1945), the United States military adopted Shewhart and Deming’s method to sustain the quality of equipment and supplies in the face of increasing demand. This adaptation was not to last long however and soon after the war ended, normal industrial activity soon resumed in the US. But Japan had taken notice.
They invited William Deming in the 1950s to lecture select captains of industry on how to implement SPC. Japanese industries quickly keyed into the benefits and soon enough Japan began to ramp up the production of high-quality products and even export to the United States and Europe.
Statistical Process Control for manufacturers
What gets measured, gets improved
Statistical process control is the use of statistical methods to quantify, monitor, and control independent process inputs in order to meet the quality requirements of the manufacturer. The 14 statistical and analytic tools used in SPC are tabulated below:
| Statistical (quality control) tools | Analytical (supplemental) tools |
|---|---|
Cause and effect diagram | Defect maps |
Histogram | Sample size determination |
Pareto Chart | Randomization |
Stratification | Data stratification |
Control chart | Process flow charts |
Scatter diagram | Progress centers |
Check sheet | Event logs |
In SPC, the process to be controlled is measured to obtain data. This data is then analyzed statistically to determine whether the process is proceeding normally or a defective product will soon occur. Here, the state of the process is determined based on a wider than normal variation of the data sets.
By focusing on the internal conditions of production, SPC enables manufacturers to monitor the behavior of the process and proactively control quality. It measures input to prevent defects and ensures that manufacturers don’t have to rely on costly and less instantaneous post-production inspections to control quality. It is widely acknowledged as one of the best approaches for quality control in manufacturing and brings about consistency, process continuity, and waste reduction.
The SPC control chart
The SPC control chart is a process monitoring tool and one of the major techniques for analyzing SPC data. It is a graphical illustration of the production process, and in its simplest form, shows a plot of quality data on the y-axis against the time/ number of samples on the x-axis. Control charts may be plotted off variable quality data or attribute data i.e., human ascribed characteristics of the process.
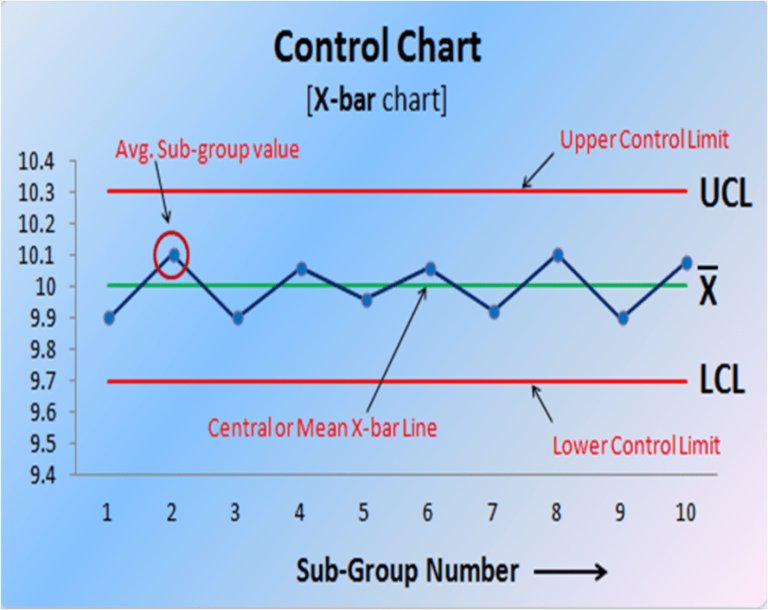
Regardless of what data type appears on the y-axis, predetermined control limits are incorporated into the chart. These limits may be based on specific historical or documented parameters that the process is expected to run. The production process is graphically evaluated based on how much variance exists between the plot and the control limit.
There are two types of variations in the control chart – common cause variation or special cause variation. The former are the inherent variations present in every production process and the latter is often an indicator that the process has gone wrong, and that the process requires further testing.
Digitalization and SPC: A match made in heaven
The advent of digital transformation has simplified statistical process control to a series of installations and clicks. Whereas in the 1950s, the Japanese had to manually collect production data at regular intervals, nowadays factories can simply install sensors at strategic areas in the production terminals and have these sensors feed data directly to Connected Worker platform solutions.
On the platform, statistical analysis can be set to perform in real-time or at specific periods via machine learning and artificial intelligence. Having already established a normal variation pattern as a basis for contrast, alerts can be triggered when special cause variations occur. Connected Worker platforms also enable manufacturers to ‘program’ a real-time SPC chart to hasten the identification of quality and monitor this chart from the comfort of mobile devices.